

This Has Happened Before
The Nifty 50, the Magnificent 7, two wars, two oil shocks, and what investors who ignored the parallels lost for a decade.

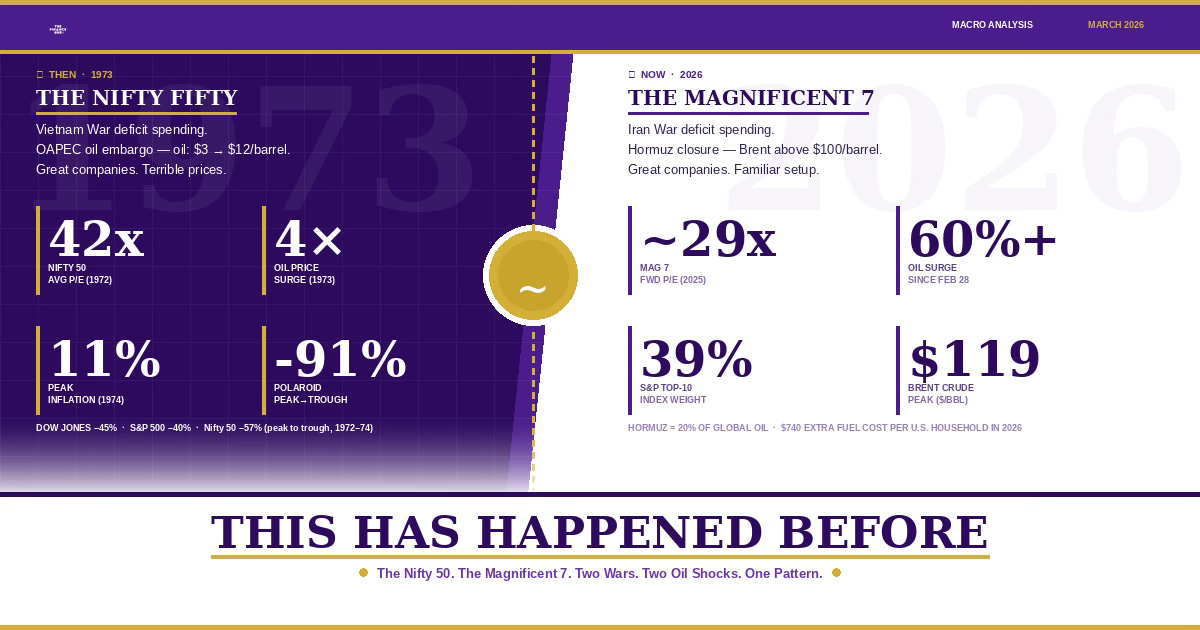
History does not always repeat, but it rhymes often enough to be useful. On October 17, 1973, a group of Arab oil ministers gathered in Kuwait and announced they were cutting oil production by 5% per month. Two days later, the full embargo United States hit. The U.S. was not the oil producer it is right now, and the price of a barrel of crude at the time had been $3. By the end of that year it would be near $12. America had been running deficits to finance a war in Vietnam it could not win. The most beloved stocks were trading at elevated price-to-earnings ratios and the investors that believed the good times were permanent were about to learn a defining lesson: great companies can still be terrible investments when you pay the wrong price at the wrong moment in the cycle.
Today, fifty-three years later, the structural setup is uncomfortably similar. The Strait of Hormuz is effectively closed. Oil is almost $100 per barrel. The United States is actively in a war in the Middle East while running a multi-trillion dollar deficit. 7 technology companies carry the weight of an entire market sitting at valuations that leave little room for error. Any investor who studies 1973 with honesty will be better positioned for the next two to five years than the investor who dismisses it as ancient history.
Before we dive into the topic of the day, I’ll share a cool and random economic fact of the week. Let’s call these RBI’s (Random But Interesting). These facts will give us useful info, often with a picture or chart to make it clearer. The aim is to help us make smarter financial choices
Random But Interesting (RBI)
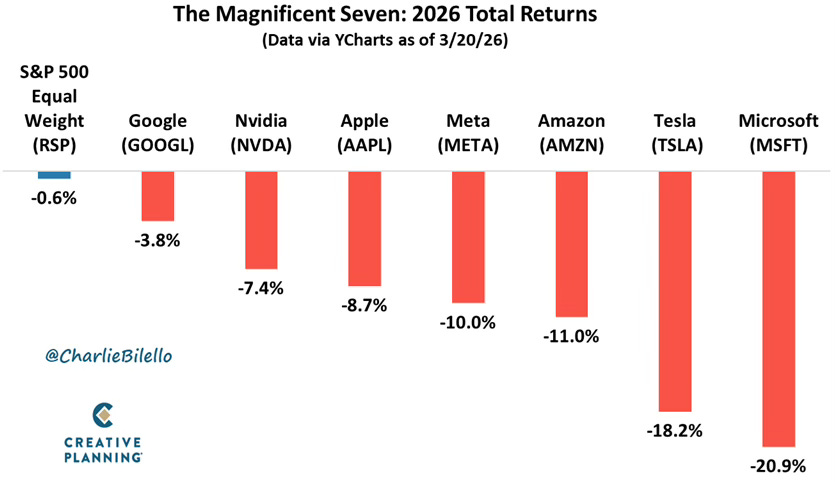
The Magnificent Seven are down approximately 7% year to date, underperforming a broader market that is itself off roughly 5% in 2026. That spread tells you something important: the index is falling, and its largest positions are falling faster. Microsoft is down nearly 21%. Tesla and Amazon have each shed more than 18% & 11% respectively. Every name in the group is in the red. Mag 7 profit growth is now expected to come in at 18% in 2026, the slowest pace since 2022, and only modestly ahead of the 13% projected for the other 493 companies in the S&P 500. That narrowing gap is the entire problem. Investors paid a 29-30x earnings multiple on the assumption that these companies would grow at a structurally different rate than everything else. That assumption is eroding. The companies did not get worse. The math just stopped working in their favor.
The Finance Hub is a reader-supported publication. To gain access to premium content and live webinar replays, consider becoming a paid subscriber
Now, back to our regular scheduled topic:
The Nifty 50: One-Decision Stocks at Any Price
By the end of 1972, fifty large-cap growth stocks had become institutional favorites. Fund managers called them “one-decision stocks.” Buy them. Never sell. Xerox. Polaroid. Disney. McDonald’s. Avon. IBM. Pfizer. These were the dominant, cash-generating businesses of their era. They had all delivered real earnings growth and had competitive moats. The problem was the price.
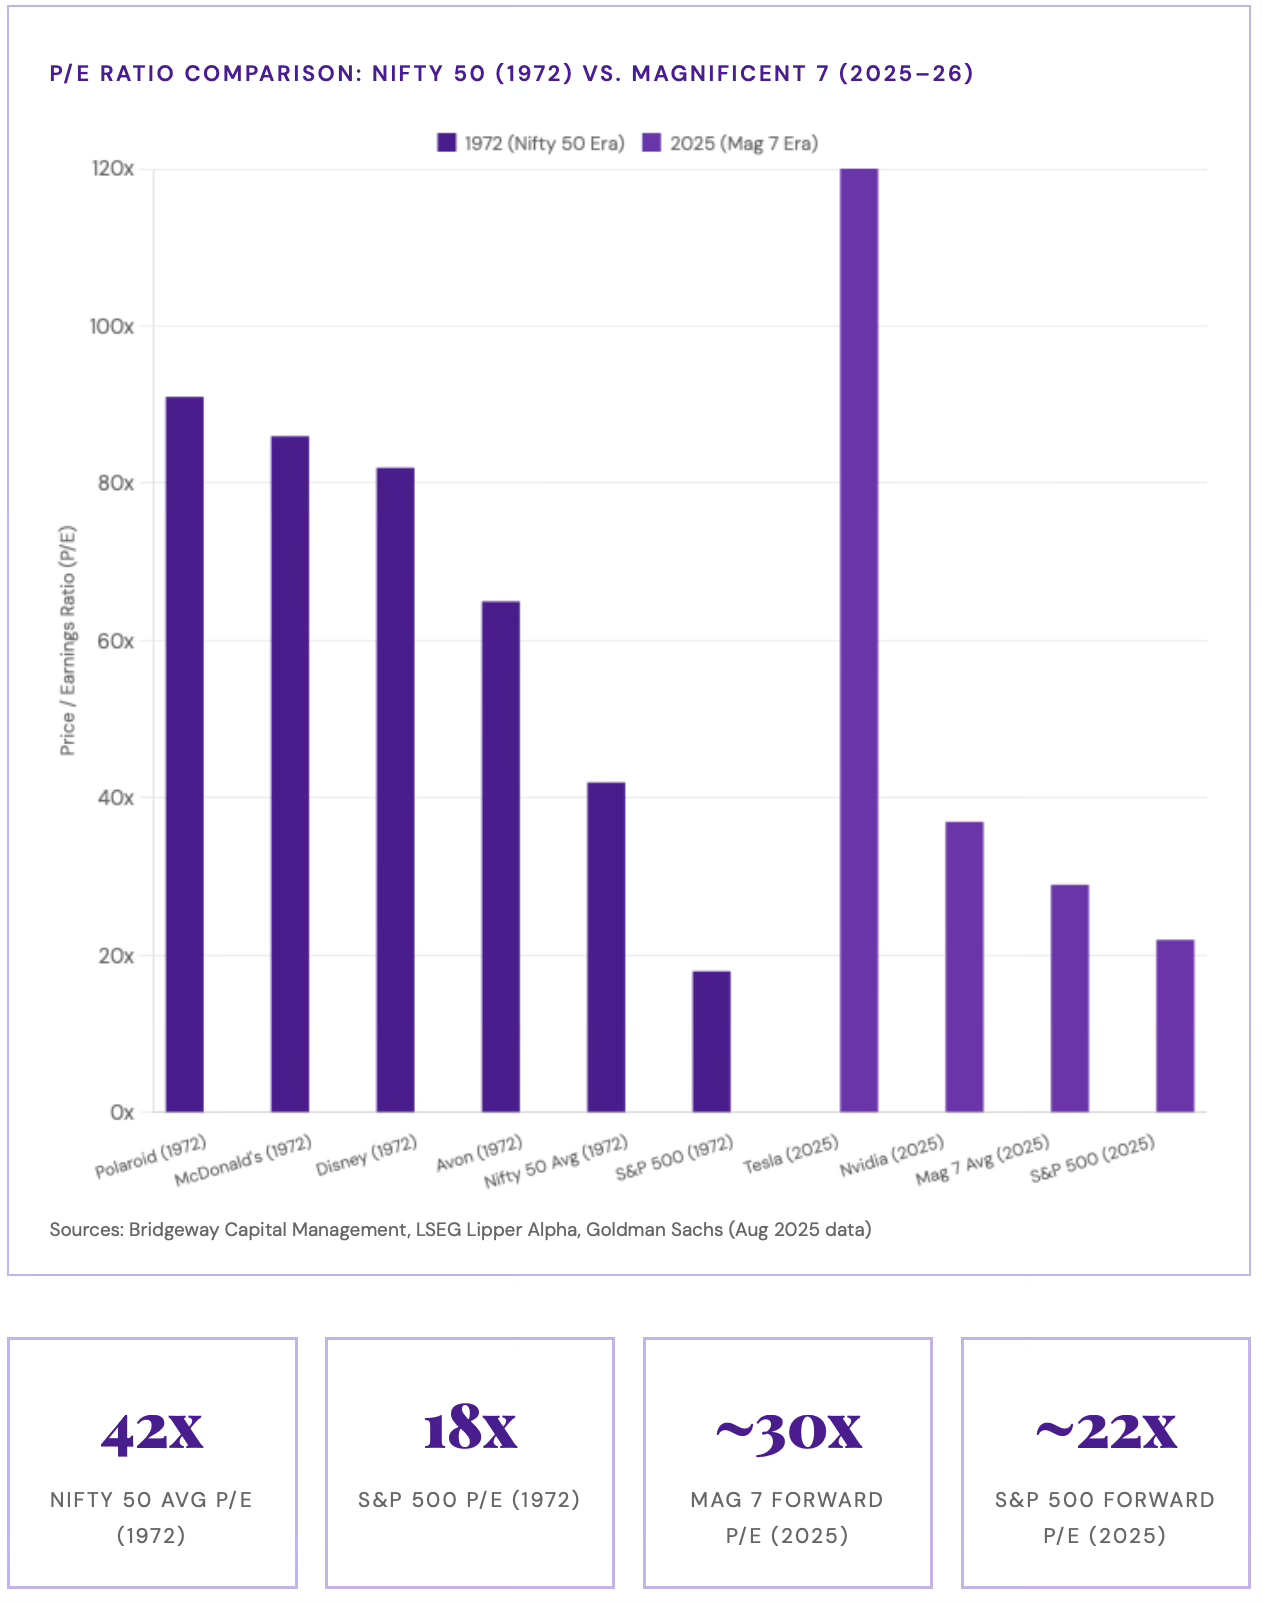
The Nifty 50 averaged a price-to-earnings (PE) ratio of 42x at their 1972 peak. Price-to-earnings measures the share price relative to the company's earnings. It can also be looked at as the inverse of the earnings yield implied by the stock. So a P/E of 42x is equivalent to an earnings yield of 2.4% (1 divided by 42). The S&P 500 at the time traded at 18x. Polaroid commanded a P/E of 91. McDonald’s traded at 86x. Walt Disney was at 82x. Avon Products at 65x. The “nifty fifty” were not speculative technology startups. They were tried and true companies like Coca-Cola and Xerox. Real companies with real earnings. But they were priced as if nothing could go wrong for a generation.
What the Nifty 50 taught investors is that valuation matters even when the underlying business is excellent. Investors who bought at the 1972 peak and held on did eventually earn market-rate returns, but it took them over a decade to get back to even. In the 1973-74 bear market, the S&P 500 fell 14% in 1973 and 26% in 1974. The Nifty 50 fell harder: down 19% in 1973, then 38% in 1974. Polaroid lost 91% of its value from peak to trough. Avon fell 86%. Xerox dropped 71%. McDonald’s, the most dominant fast-food business in American history, fell 70%.

The Magnificent 7: The New One-Decision Stocks
Apple. Microsoft. Nvidia. Alphabet. Amazon. Meta. Tesla. These seven companies now account for approximately 35% of the entire S&P 500 by market capitalization. The top ten companies in the index collectively represent 39% of its weight, according to Goldman Sachs data from August 2025. For context, the previous peak in market concentration was 27%, reached during the dot-com bubble of 1999-2000.
The bulls have a legitimate point. The Magnificent 7 generate real earnings. Their trailing net profit margin runs around 25.8%, nearly double the 13.4% of the broader S&P 500. Their earnings per share growth has tripled that of the rest of the index since 2020. They are genuine businesses with real competitive advantages.
But the valuation premium still matters. The Mag 7 group traded at a forward P/E of approximately 28-30x heading into 2026. The S&P 500 ex-Mag 7 sits at roughly 20x. When a concentrated group of stocks trades at a significant premium and an external shock arrives, that premium is the first thing to compress.
Two Wars, One Pattern: Deficits Before the Shock
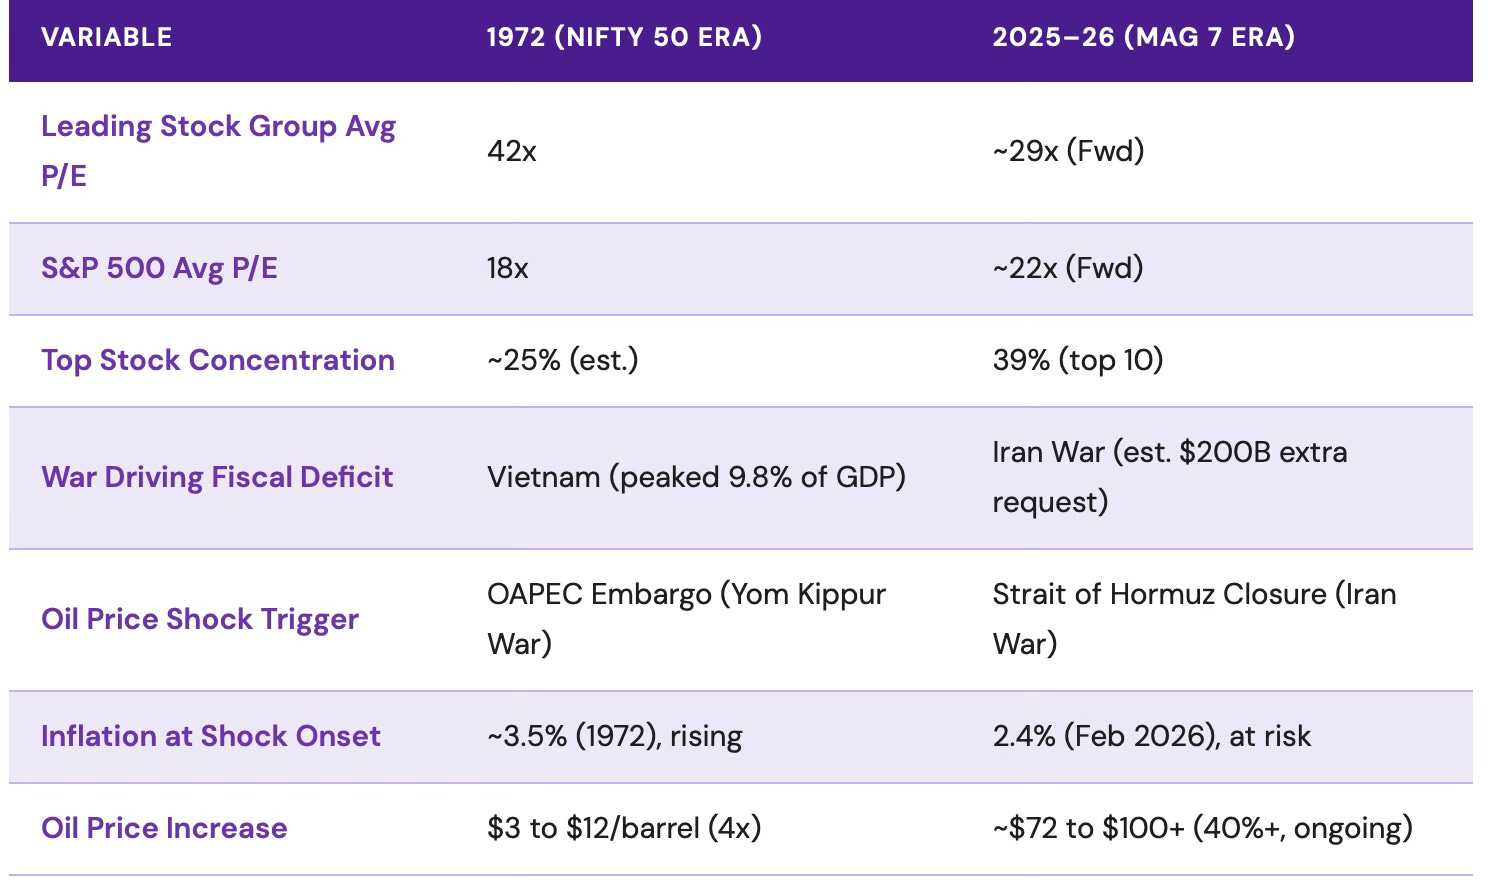
The 1973 oil crisis did not happen in a vacuum. The inflationary foundation had been laid for years before OAPEC (Organization of Arab Petroleum Exporting Countries) announced the embargo. The Vietnam War was being financed through deficit spending with no meaningful tax increases until 1968, by which point inflation had already climbed to 3.6%. Military spending peaked at 9.8% of GDP in 1968. Combined with President Johnson’s Great Society domestic programs, federal outlays consistently exceeded revenues. By the time the oil shock hit in October 1973, the U.S. economy was already running above capacity with embedded inflation. The energy shock was an accelerant the existing situation.
Today, the United States entered 2026 with a federal deficit running at approximately 6-7% of GDP before a single bullet was fired at Iran. On February 28, 2026, the U.S. and Israel launched military operations against Iran. The Pentagon subsequently requested $200 billion in additional emergency defense funding. That spending lands on top of an existing fiscal position that has not produced a balanced budget in over 20 years. The structural parallel is direct: a costly, open-ended military engagement layered on top of a fiscal base that was already stretched.
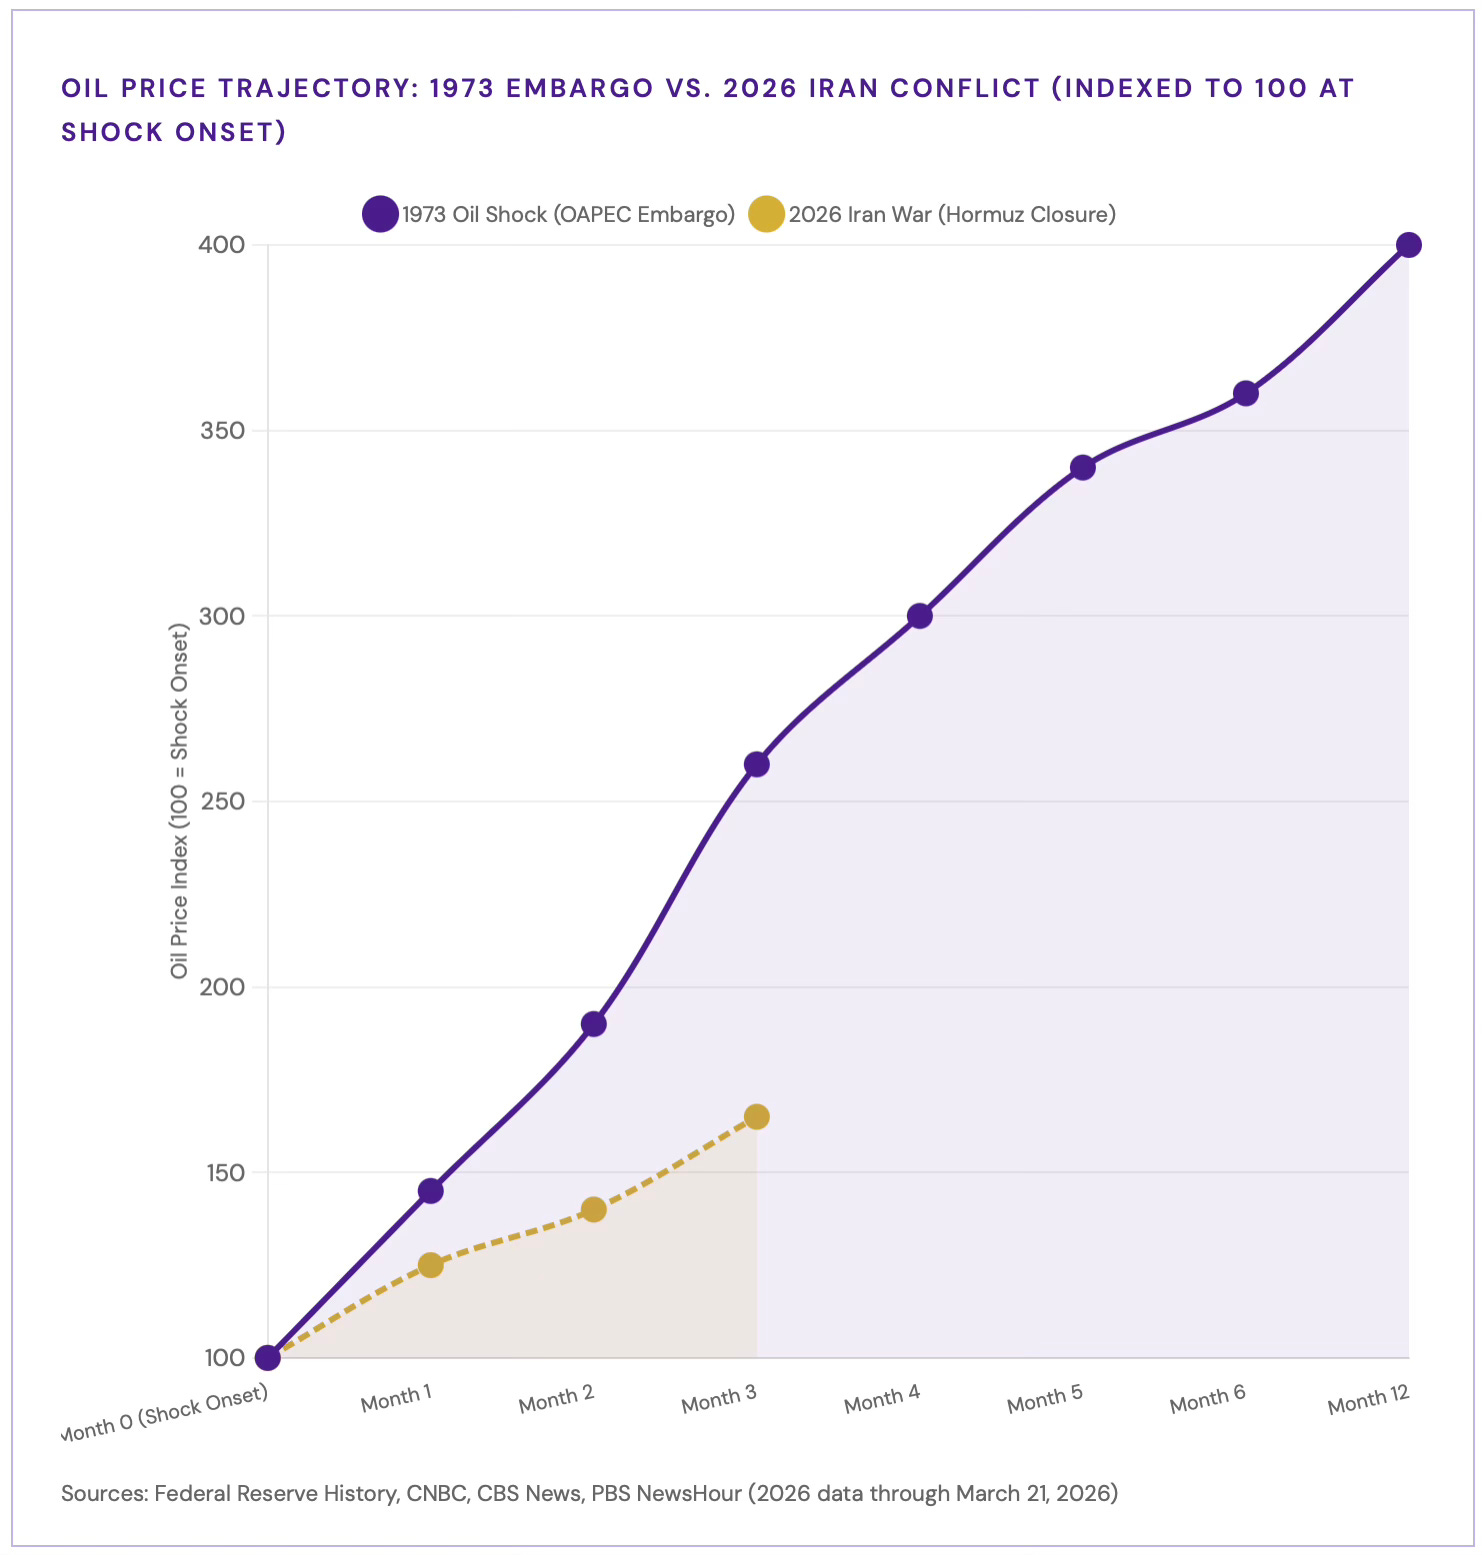
The Oil Shock: Hormuz vs. the Embargo
In October 1973, OAPEC cut production and banned oil exports to the United States. The price of crude went from $3 per barrel to nearly $12 by the time the embargo ended in March 1974. U.S. inflation, which had already been rising, reached 11% by 1974. The economy slid into recession. The Federal Reserve faced an impossible choice between fighting inflation and supporting growth.
What is unfolding today has structural similarities. The Strait of Hormuz, the world’s single most critical energy chokepoint, has been effectively closed since the war with Iran began. According to the U.S. Energy Information Administration, approximately 20 million barrels of oil transited the strait per day in 2024, representing roughly 20% of global petroleum consumption. That flow has been severely disrupted. Brent crude briefly surged above $119 per barrel in mid-March 2026, up more than 60% since the conflict began. U.S. oil prices have crossed $100 per barrel for the first time since 2022.
The immediate economic consequence is already measurable. Economists at the Stanford Institute for Economic Policy Research estimate the average U.S. household will spend an additional $740 on gasoline in 2026 because of the oil price spike. That figure will increase if the Strait closure extends into the summer months. Saudi Arabia has begun rerouting oil westward toward the Red Sea to bypass the Strait, but with limited pipeline capacity, that alternative can accommodate only a fraction of normal traffic. Several Gulf energy facilities, including Qatar’s Ras Laffan LNG terminal, Kuwait’s Mina Al-Ahmadi refinery, and multiple Abu Dhabi gas operations, have been struck in the expanding conflict.
Inflation: Surface Calm Before the Reassessment
U.S. CPI came in at 2.4% year-over-year in February 2026, the lowest reading since May 2025. The number looks benign on its surface. But it was collected before the full energy shock from the Iran war had propagated into consumer prices. Oil price increases do not hit the CPI immediately. They work through the economy with a lag of weeks to months, showing up first at the gas pump, then in transportation costs, then in food prices and manufactured goods.
In 1973-74, inflation had been running at 3.5% when the oil embargo began. It reached 11% by 1974. The oil shock alone was responsible for significant inflation, but the underlying fiscal excess meant the Fed had almost no room to act without triggering recession. The same dynamic now presents itself. The Fed was already dealing with inflation stuck above target. Tariffs imposed in 2025 pushed prices modestly higher. An energy shock layered on top of that base creates a genuine stagflation risk, where slowing growth and rising prices force policymakers into an unwinnable trade-off.

What Is Different (And What Is Not)
An honest comparison requires acknowledging the differences. The U.S. is now a net energy exporter. Shale production provides substantial domestic supply that did not exist in 1973. The Federal Reserve has better institutional knowledge of stagflation from the Volcker era. The Magnificent 7 have real cash flows, not speculative earnings. And concentrated markets can stay concentrated for longer than fundamental analysis suggests they should because of structural passive flows.
But the structural logic that drove the 1973-74 collapse remains intact. High-multiple stocks depend on a stable or declining discount rate. When oil prices rise sharply, inflation expectations rise with them. When inflation rises, the Fed cannot cut rates. When rates stay elevated, the present value of long-duration earnings compresses. The mechanism is the same today as it was in 1973: the high-valuation premium disappears when the macro environment reprices risk.
The other difference worth noting is geography. In 1973, the U.S. domestic oil industry was declining and the country was heavily import-dependent. Today, domestic producers benefit directly from high oil prices. That is a genuine distinction with real investment implications.
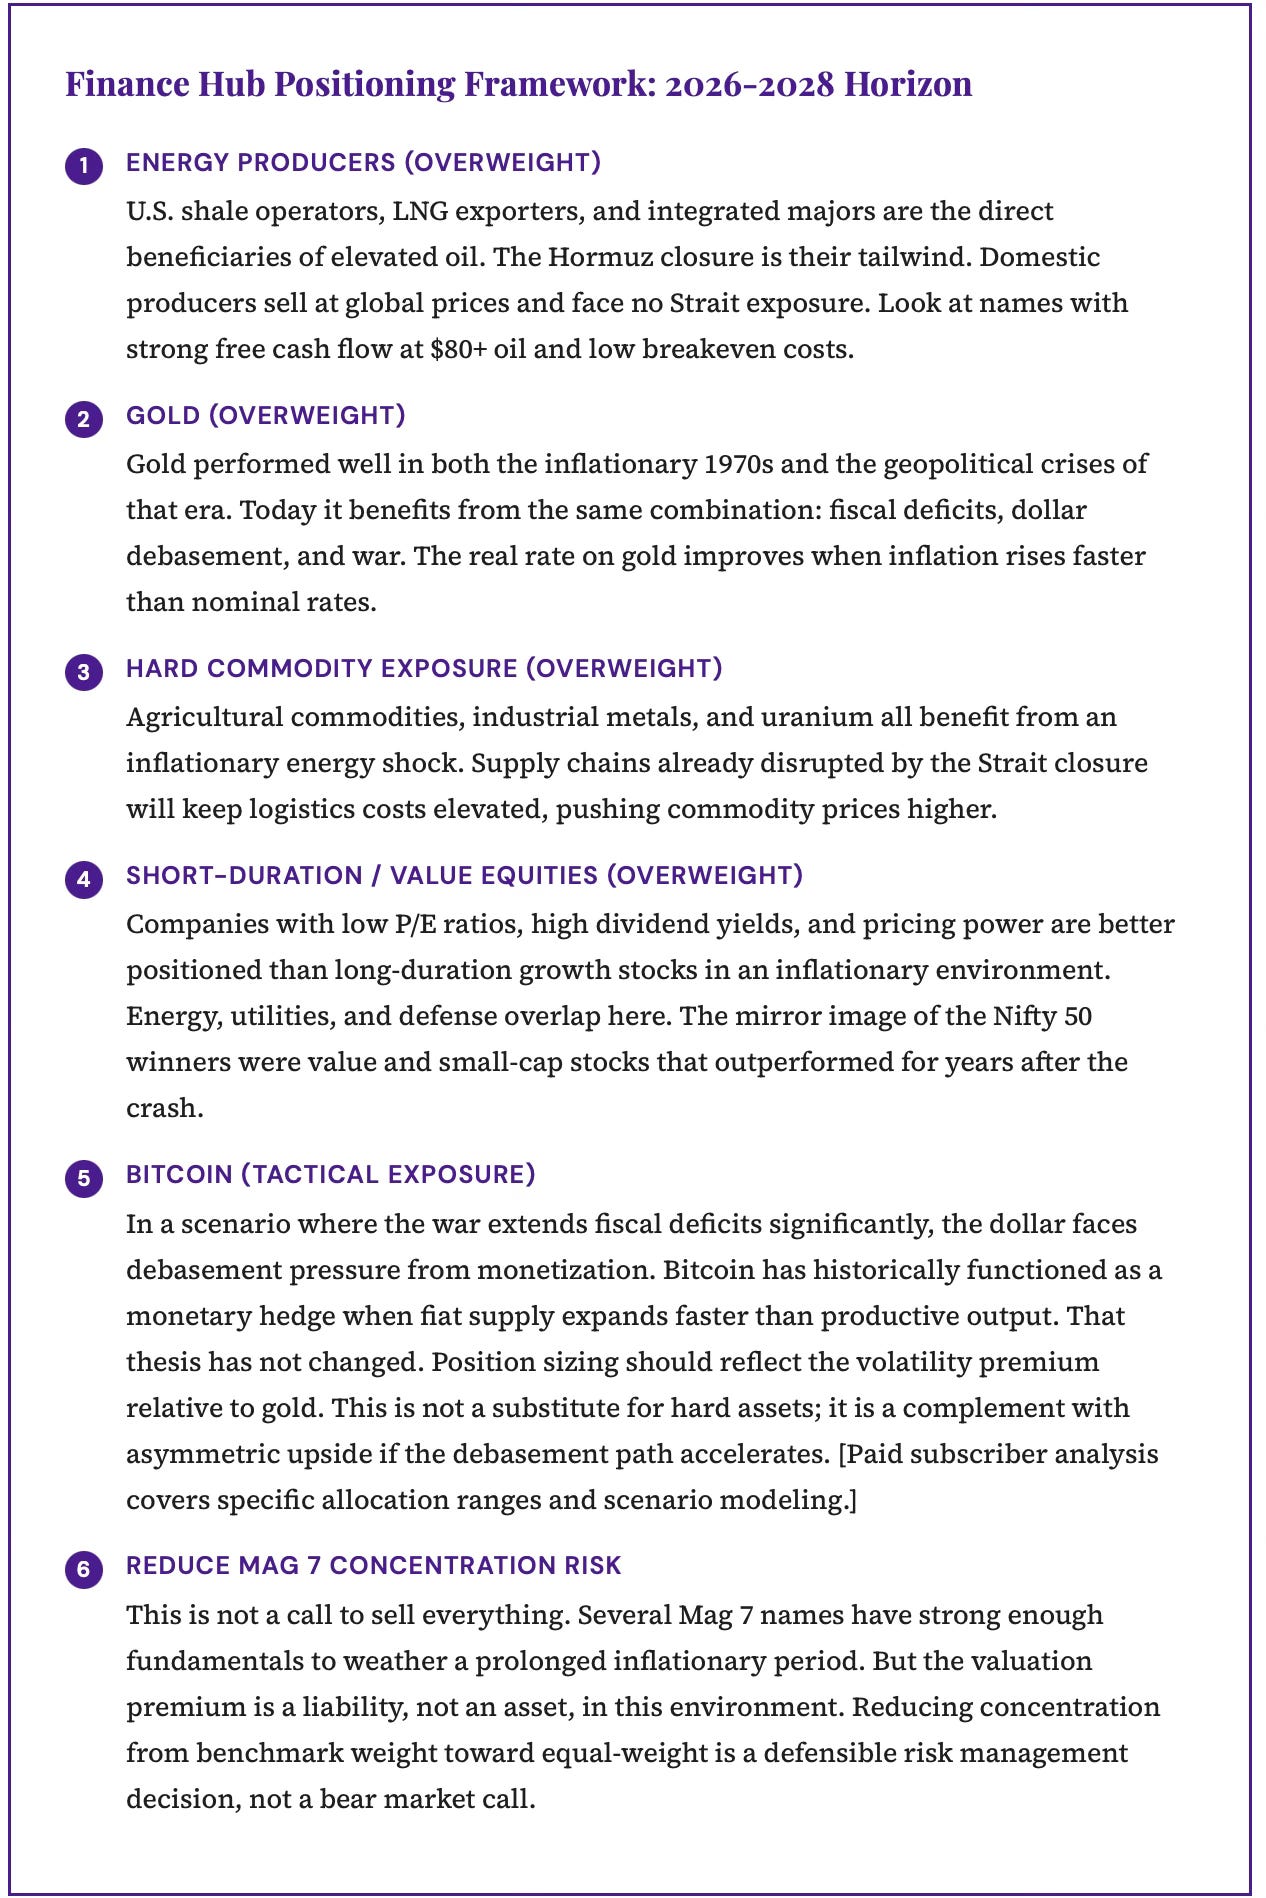
Positioning for the Next Two to Five Years
After the Nifty 50 collapsed in 1973-74, a specific set of assets outperformed for years. Gold rose dramatically through the decade. Energy producers compounded at rates that growth stocks could not match. Value stocks beat growth stocks. Small-cap companies outperformed large-cap companies. Commodities broadly outpaced financial assets. The logic was consistent: hard assets hold their value when paper assets reprice to reflect the reality of higher inflation and higher rates.
The Questions That Matter
The two most important variables to track over the next six to twelve months are the duration of the Hormuz disruption and the Fed’s response to oil-driven inflation.
If the Strait reopens quickly and energy prices recede below $85 per barrel, the inflationary risk is contained. Growth stocks can hold their premiums. The parallel to 1973 weakens. That outcome is possible, and investors should not position as if it is impossible.
But if the conflict extends into summer, if the Strait remains partially closed, and if Brent crude holds above $100 through the second half of 2026, then the U.S. economy will face the same arithmetic that crushed the Nifty 50: rising costs, compressed margins, higher discount rates, and the brutal math of revaluing assets that had been priced for a world that no longer exists.
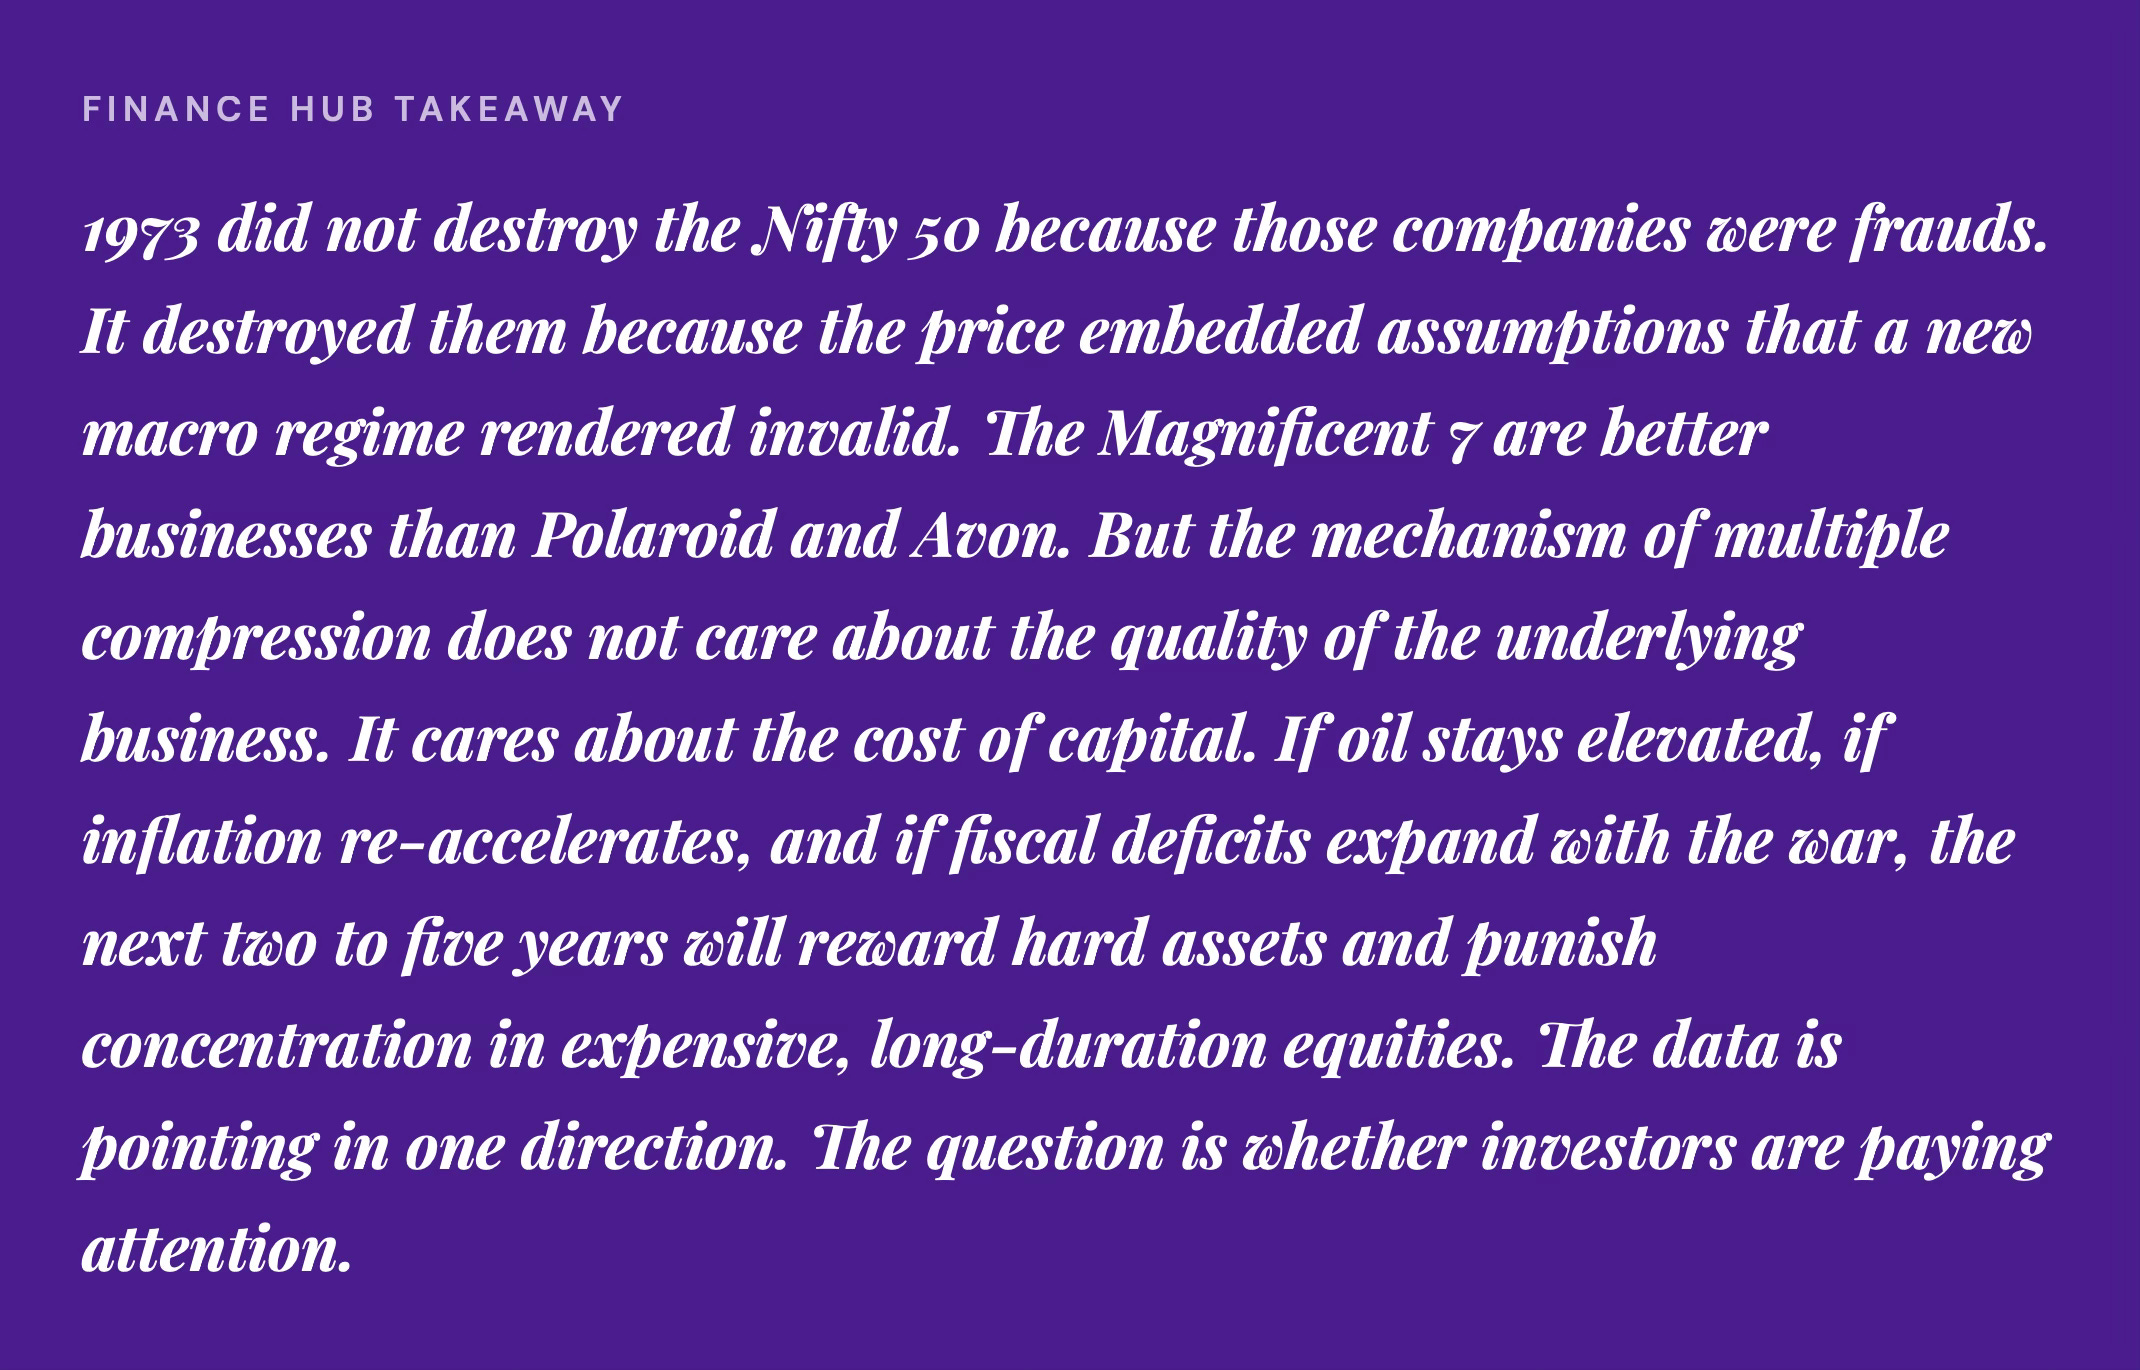
The Nifty 50 investors were not stupid. They owned real companies with real earnings. Their mistake was not the companies they chose. It was the price they paid and the macro environment they ignored. They assumed the good times were durable because the good times had been durable for years. That assumption cost them a decade.
Finance Hub members can access a deeper dive into tactical positioning for Bitcoin and an allocation strategy in the addendum post.